
CPM is the metric almost every brand watches when costs start climbing. It feels logical - if you're paying more per thousand impressions, something must be wrong. But CPM doesn't tell you whether those impressions are landing on new people or recycling through the same audience for the sixth time this week. That distinction is everything, and it's exactly what CPM hides.
The metric that actually answers the question is CPMr - cost per 1,000 accounts reached. The difference between the two isn't semantic. It's the difference between diagnosing your account correctly and making the wrong call on budget, creative, or targeting while your costs quietly compound.
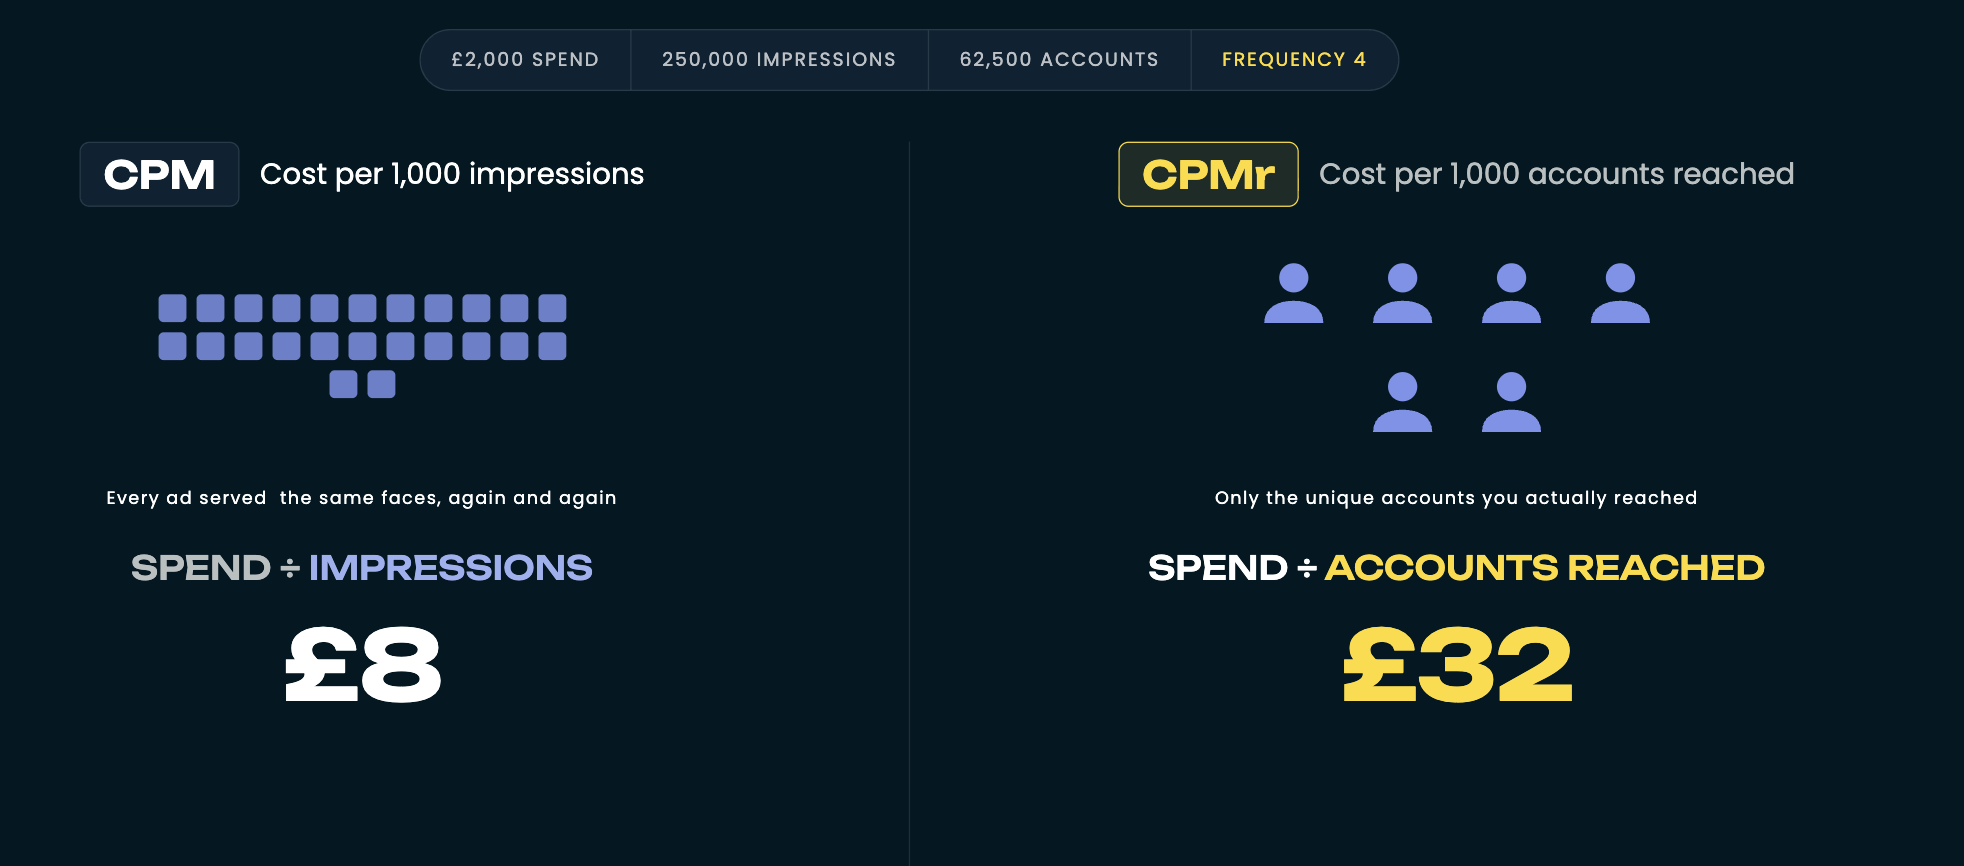
CPM measures impressions. Every time an ad is served regardless of who sees it. If the same 10,000 people each see your ad five times, you've generated 50,000 impressions. Your CPM looks fine but your reach hasn't moved.
This is the core problem, CPM is a delivery metric. It tells you how efficiently your budget is being spent on ad serve events, not on new eyeballs. When your audience starts saturating (when Meta's delivery system is serving your ads to a narrowing pool of people who've already seen them repeatedly)CPM can stay flat or even drop while your actual cost to reach a unique person climbs significantly.
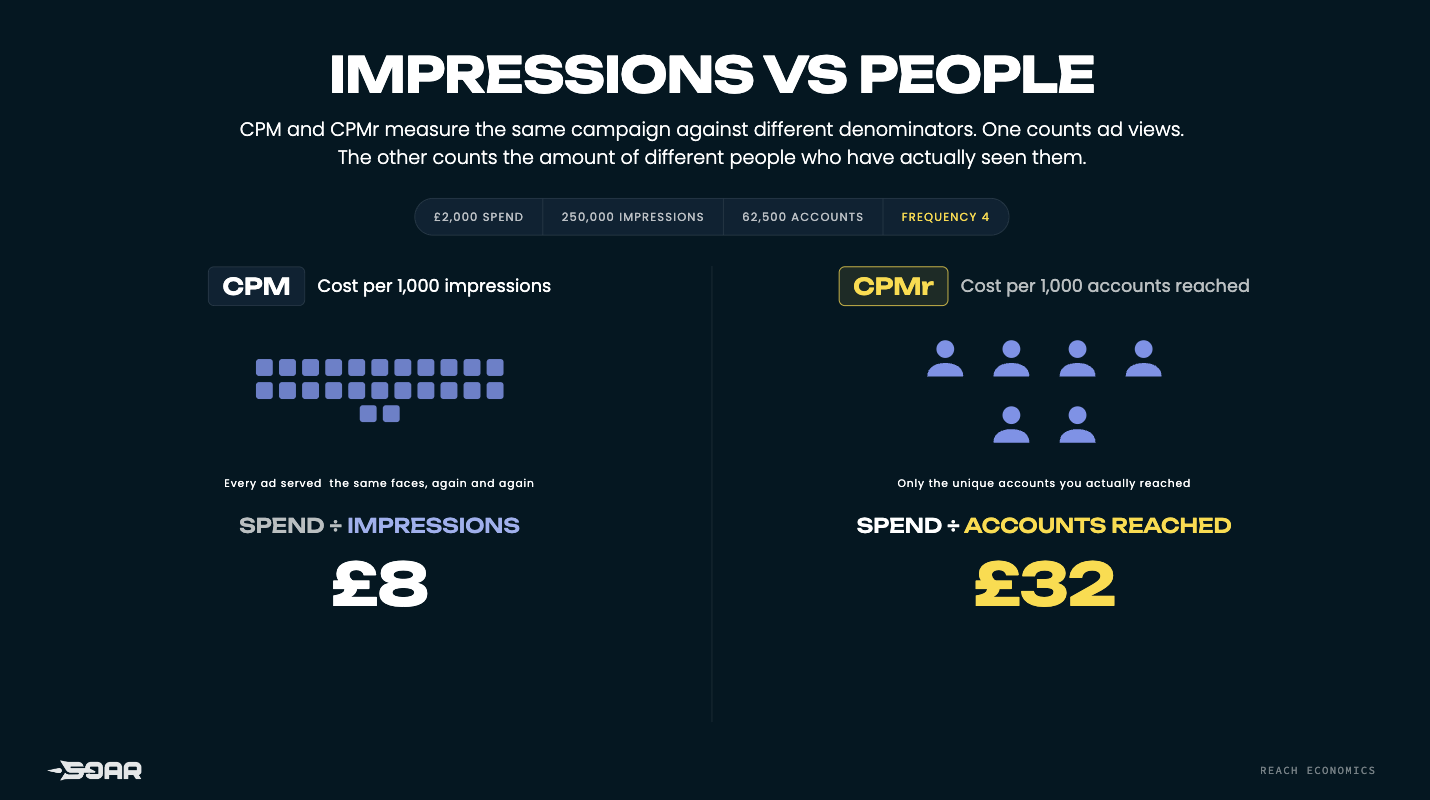
We've seen accounts where CPM sits at £11–12 while CPMr is north of £32. On the surface, the campaign looks efficient. In reality, the brand is paying nearly three times as much per unique person reached as they think they are, and frequency is doing the heavy lifting on that gap. Unfortunately, it's a reach saturation problem which CPM will never flag it.
This matters especially when you're scaling spend. As budgets increase, Meta's algorithm doubles down on the audience segments it's confident will convert. Those tend to be people who've already engaged with your brand. They're effficient in the short term but a saturation trap in the medium term. The warning signal doesn't show up in CPM, it shows up in CPMr.
CPMr isn't a native metric in Meta Ads Manager, you won't find it in a dropdown. But it's straightforward to calculate from data you already have:
CPMr = CPM × Frequency
That's it. Take your CPM, multiply by your frequency for the same period, and you have the normalised cost to reach a unique account once. The reason frequency appears in the formula is that it captures how many impressions have been served per unique person reached. A CPM of £10 with a frequency of 1.2 gives you a CPMr of £12. That same £10 CPM with a frequency of 3.5 gives you a CPMr of £35. The same delivery cost, but you're paying three times as much per unique person because you're showing ads to the same people over and over.
The value of tracking CPMr over time is directional, you're essentially trend watching. A stable or declining CPMr tells you that as you spend more, you're reaching new people at roughly the same or better efficiency. A rising CPMr tells you the opposite: incremental spend is going to the same pool, and you're paying a premium for diminishing returns.
We cover the full measurement framework, including how to read frequency trends alongside CPMr, in our Incremental Reach guide, which also addresses what to do when CPMr starts climbing.
If you have a Meta rep, the most precise way to diagnose reach saturation is to request a Reach Saturation Analysis. This is a formal report your rep can pull, available monthly for most accounts, sometimes weekly for larger spenders that gives you a breakdown that CPMr alone can't provide.
The report includes two key outputs. The first is a Monthly Reach Structure Chart, which splits your total impressions into three buckets: impressions delivered to previously reached individuals, net new incremental reach, and the percentage of total impressions that were genuinely incremental. That last number is your First-Time Impression ratio. Healthy accounts typically sit at 10–20% incremental reach on a monthly basis. Below 10% is a saturation signal that requires action.
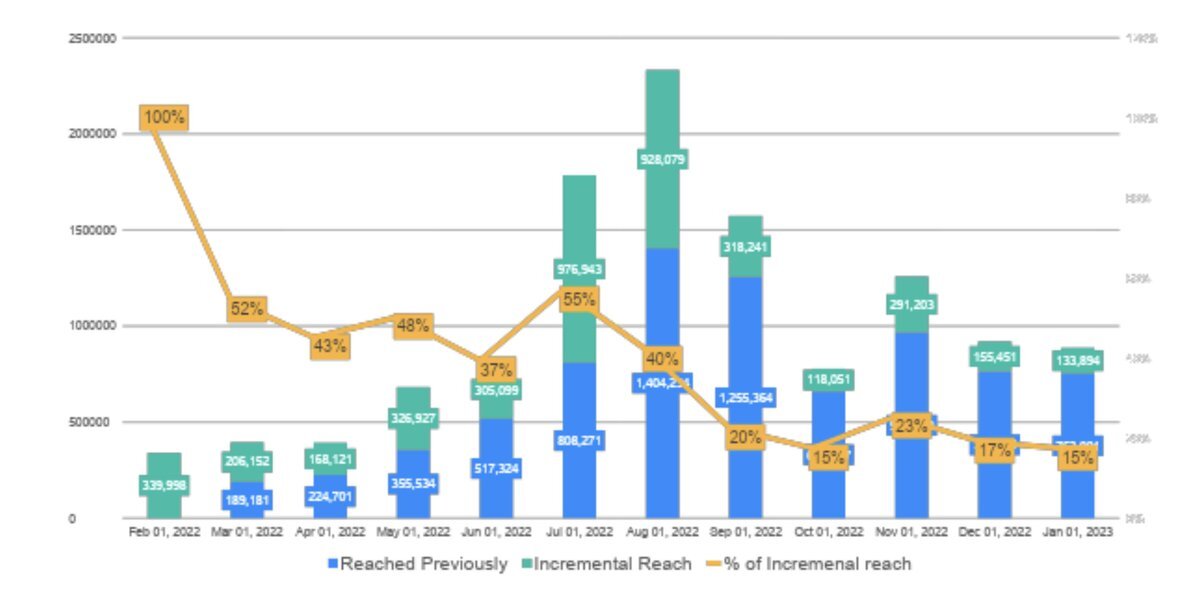
The second output is the Reach Segmentation Chart, and this one is particularly useful because it shows you not just how saturated you are, but where the opportunity lies. The chart divides your addressable audience into distinct segments:
The diagnostic logic here is important. A large High Frequency segment with a shrinking Untapped segment is classic saturation, you've exhausted your pool and you're cycling through it. A large Untapped segment with a small Low Frequency segment suggests the opposite problem: there's reachable audience that your delivery system simply isn't finding, often because of creative homogeneity rather than budget constraints. Understanding where your incremental reach is hiding is often the first step to unlocking it.
CPMr tells you that something is wrong. The Reach Segmentation Chart tells you which problem you're actually solving.
When CPMr climbs, there are two distinct causes and they require different responses. Conflating them is one of the more common mistakes we see in accounts spending at scale.
The first cause is genuine market saturation: you've reached a meaningful proportion of your addressable audience, and additional spend is inevitably going to the same people. This shows up as a High Frequency segment that keeps growing regardless of budget adjustments. The fix here involves audience expansion - new creative formats that unlock different personas, interest or lookalike layers that introduce Meta to new segments, or testing different placement strategies to access audiences your current delivery isn't finding.
The second cause is creative convergence: your ads are structurally similar enough that Meta's delivery system treats them as targeting the same persona, regardless of how different they appear to you. Two ads with different hooks but similar visual formats, colour palettes, and product framing can register as effectively identical to Andromeda, Meta's retrieval engine, which uses visual pattern matching to categorise creative. When this happens, your ads compete for the same narrow audience slice even if you believe you're running variety. CPMr rises not because the audience is exhausted but because your creative isn't diversified enough to access the audience that exists. Our Meta Ads management work almost always starts by diagnosing which of these two causes is driving CPMr up, because the interventions are completely different.
CPMr is the number that surfaces this distinction. Without it, you're either cutting budget unnecessarily because you think the market is saturated when your creative is the problem, or you're pushing spend harder into a genuinely exhausted audience and wondering why ROAS won't recover.
The practical shift is straightforward. CPMr should sit alongside CPM in your standard reporting, tracked weekly at the ad set level. The calculation takes seconds if you have CPM and frequency visible, which you should by default.
Set a directional threshold rather than a fixed target. A CPMr that's rising 15–20% week-over-week without a corresponding increase in reach is a clear signal to investigate. A CPMr that's stable or declining as you scale spend is confirmation that your incremental reach strategy is working.
At the campaign level, pair CPMr with your First-Time Impression ratio if you have Meta rep access, or with frequency trends as a proxy if you don't. Frequency creeping above 3–4 over a 7-day window, combined with a rising CPMr, is your clearest proxy for saturation before you have access to the full Reach Saturation Analysis.
The goal is to use CPMr as an early warning system. CPMr is a leading indicator of the problems that eventually show up in CPA and ROAS, typically 2–4 weeks later. The full framework for tracking incremental reach - including how to use the Reach Segmentation Chart to prioritise where to focus - is laid out in our Incremental Reach guide.
The immediate action is simple: pull your CPM and frequency for the last four weeks at ad set level. Calculate CPMr for each week. If it's climbing, you have your answer. The next question is whether the problem is in your audience or your creative, and that's where the segmentation analysis earns its value.
If you need help reaching net new audiences at scale, book in a Growth Roadmap, a 4–6 week, fully refundable, strategic performance audit across your entire paid acquisition funnel. Meta, TikTok, Google, creative, and landing pages. We identify exactly where performance is leaking, and hand you a commercially ranked roadmap to fix it.
You can apply for that here

CPM is the metric almost every brand watches when costs start climbing. It feels logical - if you're paying more per thousand impressions, something must be wrong. But CPM doesn't tell you whether those impressions are landing on new people or recycling through the same audience for the sixth time this week. That distinction is everything, and it's exactly what CPM hides.
The metric that actually answers the question is CPMr - cost per 1,000 accounts reached. The difference between the two isn't semantic. It's the difference between diagnosing your account correctly and making the wrong call on budget, creative, or targeting while your costs quietly compound.
CPM measures impressions. Every time an ad is served regardless of who sees it. If the same 10,000 people each see your ad five times, you've generated 50,000 impressions. Your CPM looks fine but your reach hasn't moved.
This is the core problem, CPM is a delivery metric. It tells you how efficiently your budget is being spent on ad serve events, not on new eyeballs. When your audience starts saturating (when Meta's delivery system is serving your ads to a narrowing pool of people who've already seen them repeatedly)CPM can stay flat or even drop while your actual cost to reach a unique person climbs significantly.
We've seen accounts where CPM sits at £11–12 while CPMr is north of £32. On the surface, the campaign looks efficient. In reality, the brand is paying nearly three times as much per unique person reached as they think they are, and frequency is doing the heavy lifting on that gap. Unfortunately, it's a reach saturation problem which CPM will never flag it.
This matters especially when you're scaling spend. As budgets increase, Meta's algorithm doubles down on the audience segments it's confident will convert. Those tend to be people who've already engaged with your brand. They're effficient in the short term but a saturation trap in the medium term. The warning signal doesn't show up in CPM, it shows up in CPMr.
CPMr isn't a native metric in Meta Ads Manager, you won't find it in a dropdown. But it's straightforward to calculate from data you already have:
CPMr = CPM × Frequency
That's it. Take your CPM, multiply by your frequency for the same period, and you have the normalised cost to reach a unique account once. The reason frequency appears in the formula is that it captures how many impressions have been served per unique person reached. A CPM of £10 with a frequency of 1.2 gives you a CPMr of £12. That same £10 CPM with a frequency of 3.5 gives you a CPMr of £35. The same delivery cost, but you're paying three times as much per unique person because you're showing ads to the same people over and over.
The value of tracking CPMr over time is directional, you're essentially trend watching. A stable or declining CPMr tells you that as you spend more, you're reaching new people at roughly the same or better efficiency. A rising CPMr tells you the opposite: incremental spend is going to the same pool, and you're paying a premium for diminishing returns.
We cover the full measurement framework, including how to read frequency trends alongside CPMr, in our Incremental Reach guide, which also addresses what to do when CPMr starts climbing.
If you have a Meta rep, the most precise way to diagnose reach saturation is to request a Reach Saturation Analysis. This is a formal report your rep can pull, available monthly for most accounts, sometimes weekly for larger spenders that gives you a breakdown that CPMr alone can't provide.
The report includes two key outputs. The first is a Monthly Reach Structure Chart, which splits your total impressions into three buckets: impressions delivered to previously reached individuals, net new incremental reach, and the percentage of total impressions that were genuinely incremental. That last number is your First-Time Impression ratio. Healthy accounts typically sit at 10–20% incremental reach on a monthly basis. Below 10% is a saturation signal that requires action.
The second output is the Reach Segmentation Chart, and this one is particularly useful because it shows you not just how saturated you are, but where the opportunity lies. The chart divides your addressable audience into distinct segments:
The diagnostic logic here is important. A large High Frequency segment with a shrinking Untapped segment is classic saturation, you've exhausted your pool and you're cycling through it. A large Untapped segment with a small Low Frequency segment suggests the opposite problem: there's reachable audience that your delivery system simply isn't finding, often because of creative homogeneity rather than budget constraints. Understanding where your incremental reach is hiding is often the first step to unlocking it.
CPMr tells you that something is wrong. The Reach Segmentation Chart tells you which problem you're actually solving.
When CPMr climbs, there are two distinct causes and they require different responses. Conflating them is one of the more common mistakes we see in accounts spending at scale.
The first cause is genuine market saturation: you've reached a meaningful proportion of your addressable audience, and additional spend is inevitably going to the same people. This shows up as a High Frequency segment that keeps growing regardless of budget adjustments. The fix here involves audience expansion - new creative formats that unlock different personas, interest or lookalike layers that introduce Meta to new segments, or testing different placement strategies to access audiences your current delivery isn't finding.
The second cause is creative convergence: your ads are structurally similar enough that Meta's delivery system treats them as targeting the same persona, regardless of how different they appear to you. Two ads with different hooks but similar visual formats, colour palettes, and product framing can register as effectively identical to Andromeda, Meta's retrieval engine, which uses visual pattern matching to categorise creative. When this happens, your ads compete for the same narrow audience slice even if you believe you're running variety. CPMr rises not because the audience is exhausted but because your creative isn't diversified enough to access the audience that exists. Our Meta Ads management work almost always starts by diagnosing which of these two causes is driving CPMr up, because the interventions are completely different.
CPMr is the number that surfaces this distinction. Without it, you're either cutting budget unnecessarily because you think the market is saturated when your creative is the problem, or you're pushing spend harder into a genuinely exhausted audience and wondering why ROAS won't recover.
The practical shift is straightforward. CPMr should sit alongside CPM in your standard reporting, tracked weekly at the ad set level. The calculation takes seconds if you have CPM and frequency visible, which you should by default.
Set a directional threshold rather than a fixed target. A CPMr that's rising 15–20% week-over-week without a corresponding increase in reach is a clear signal to investigate. A CPMr that's stable or declining as you scale spend is confirmation that your incremental reach strategy is working.
At the campaign level, pair CPMr with your First-Time Impression ratio if you have Meta rep access, or with frequency trends as a proxy if you don't. Frequency creeping above 3–4 over a 7-day window, combined with a rising CPMr, is your clearest proxy for saturation before you have access to the full Reach Saturation Analysis.
The goal is to use CPMr as an early warning system. CPMr is a leading indicator of the problems that eventually show up in CPA and ROAS, typically 2–4 weeks later. The full framework for tracking incremental reach - including how to use the Reach Segmentation Chart to prioritise where to focus - is laid out in our Incremental Reach guide.
The immediate action is simple: pull your CPM and frequency for the last four weeks at ad set level. Calculate CPMr for each week. If it's climbing, you have your answer. The next question is whether the problem is in your audience or your creative, and that's where the segmentation analysis earns its value.
If you need help reaching net new audiences at scale, book in a Growth Roadmap, a 4–6 week, fully refundable, strategic performance audit across your entire paid acquisition funnel. Meta, TikTok, Google, creative, and landing pages. We identify exactly where performance is leaking, and hand you a commercially ranked roadmap to fix it.
You can apply for that here


.svg)


